Continued : Logstash getting started
To monitor exceptions, we are going to need a little more than grep. Replace the filter section of the test.conf file attached in the previous post with this.
filter {
multiline {
patterns_dir => "D:/logstash/logstash-1.1.9-monolithic/patterns"
pattern => "^(%{MONTH}|%{YEAR}-)"
negate => true
what => "previous"
type => "loglevel"
}
grok {
patterns_dir => "D:/logstash/logstash-1.1.9-monolithic/patterns"
pattern => ["(?m)(?<logdate>%{MONTH} %{MONTHDAY}, %{YEAR} %{DATA} [AP]{1}M{1}) %{NOTSPACE:package} %{WORD:method}.*%{LOGLEVEL:loglevel}: %{GREEDYDATA:msg}"]
singles => true
}
grep {
# Answers the question - what are you looking for?
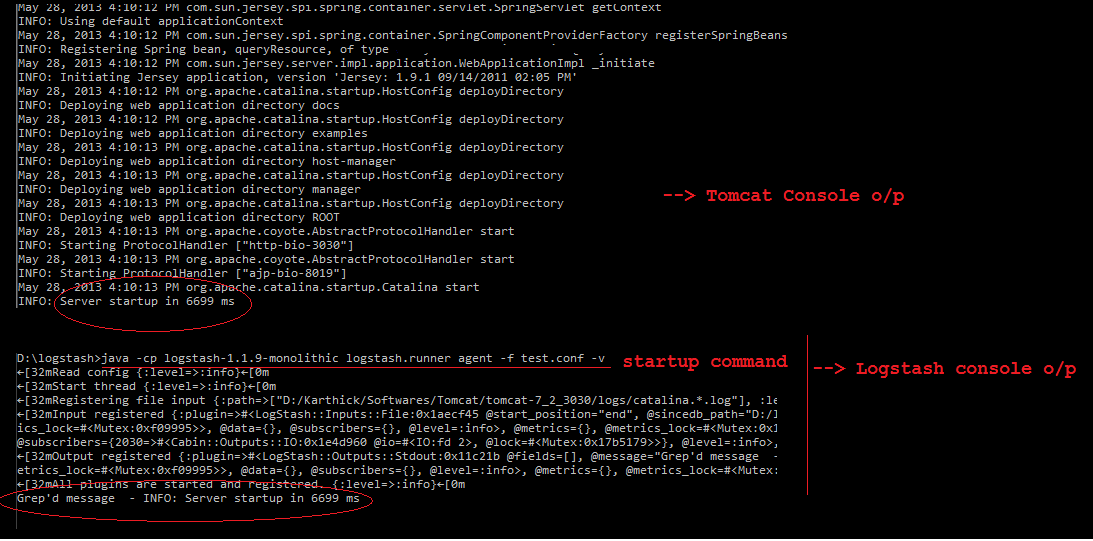
# In this example, I am interested in server start up.
# @message - maps to one log statement/event and I have defined a grep to match the word
# 'Server startup' in the message.
match => ["@message","CannotLoadBeanClassException"]
type => "loglevel"
}
}
Grep matches a word in a line (CannotLoadBeanClassException) but we
need a bit more when it comes to getting the exception stack trace,
isn't it?
Fret not. Logstash's multiline to the
rescue. Multiline uses Grok pattern to identify a pattern.
More about Grok filters >> Here
More about Grok filters >> Here
My tomcat logs are in
this format:
May 28, 2013 6:04:30 PM org.apache.catalina.core.StandardContext startInternal
SEVERE: Error listenerStart
pattern => "^(%{MONTH}|%{YEAR}-)"
indicates that any line that begins in this format is a part of the
multi line event. So, technically, every line in our log file is a
part of the multi line event.
negate => true
When negate is set to true the lines
which doesn't match (line 101-119) the given pattern will be constituted as a part
of the multi line filter and will subsequently be added to the
previously encountered line which matches the pattern.(line 100) Phew.! ;-)
For instance at line no. 100 we have a
match and assume that the subsequent lines give away the stack trace.
Line 100:: May 28, 2013 6:04:30 PM
org.apache.catalina.core.StandardContext startInternal
.................
.................
/* A match is occurred at line 100 and the
subsequent 20 lines are added to line 100. */
....................
....................
Line 120::: May 28, 2013 6:04:30 PM
org.apache.catalina.core.StandardContext stop
This way, we will get the entire stack trace.


Now that we have the stack trace with us, its just a matter of configuring the appropriate output.
Send the message via Email or Invoke a HTTP endpoint
As Sridhar pointed out, there should be an option for the users to subscribe for a specific exception rather being spammed with all exception stack traces.
# Define grep blocks for the exceptions that you want to monitor and as
# when there is a match you can add certain feilds and use them later

grep {
               match => ["@message","NullPointerException"]
               add_field => ["exception_message", "Exception message - %{@message}"]
        add_field => ["exception_subject","NullpointerException occurred"]
               add_field => ["recipients_email","johnDoe@gmail.com"]
        type => "loglevel"
     }

grep {
        match => ["@message","IndexOutOfBoundsException"]
        add_field => ["exception_message", "Exception message - %{@message}"]
        add_field => ["exception_subject","IndexOutOfBoundsException occurred...."]
        add_field => ["recipients_email","janeDoe@gmail.com"]
        type => "loglevel"
}

# This way, you can customize the message sent for each exception.
# again, recipients, subject and message are json attributes.
# Url points to the http end point which takes care of sending out mails.
 http {
    content_type => "application/json"
    format => "json"
    http_method => "post"
url => "http://localhost:8080/services/notification/email"
    mapping => ["recipients","%{recipients_email}","subject","%{exception_subject}","message","%{exception_message}"]
    type => "loglevel"
  }
And if there are n-number of exceptions that you need to monitor you can define them in separate conf files and provide the folder as input during logstash start up using logstash's command line flags. That way, it ll be easier to maintain the conf files. One file for every exception might be an overkill but how about one conf file per module?
Makes sense? B-)
Do let me know if you try this out.
Happy Coding :)
~ cheers.!